Dashboard - New Combo Chart
June 4th 2020
What’s new?

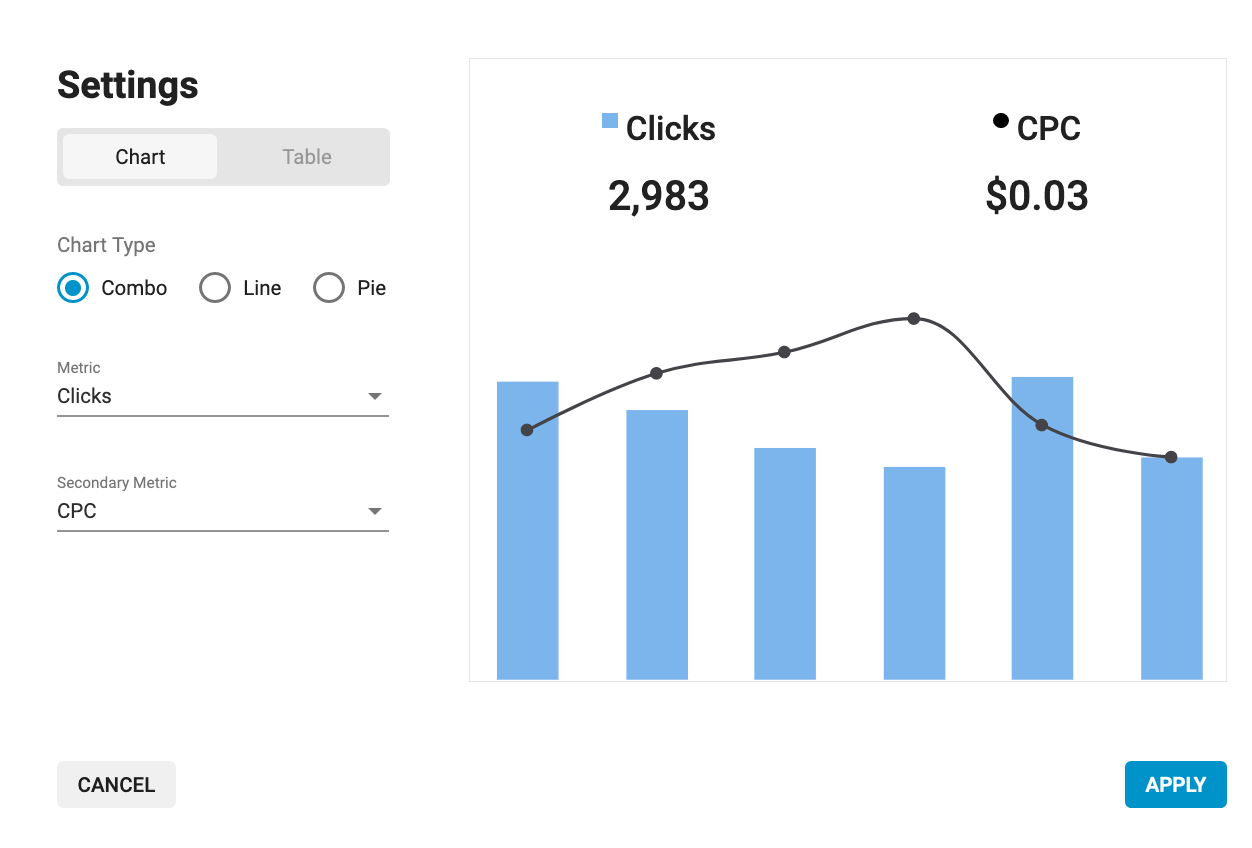
Recently we made it possible for Advertisers and Publishers to customize their Dashboard. We have now added a Combo chart, which allows you to plot a combination bar and line chart of two metrics.
What can this new feature do for me?
This feature allows Advertisers and Publishers to compare two metrics over time, to get more insights into their data.
Details

As an Advertiser or Publisher, go to your Dashboard.
In any one of the six panels, click on the settings icon in the top right.
Choose Chart and then Combo.
Select a Metric and a Secondary Metric to show in the bar/line chart and click Apply.
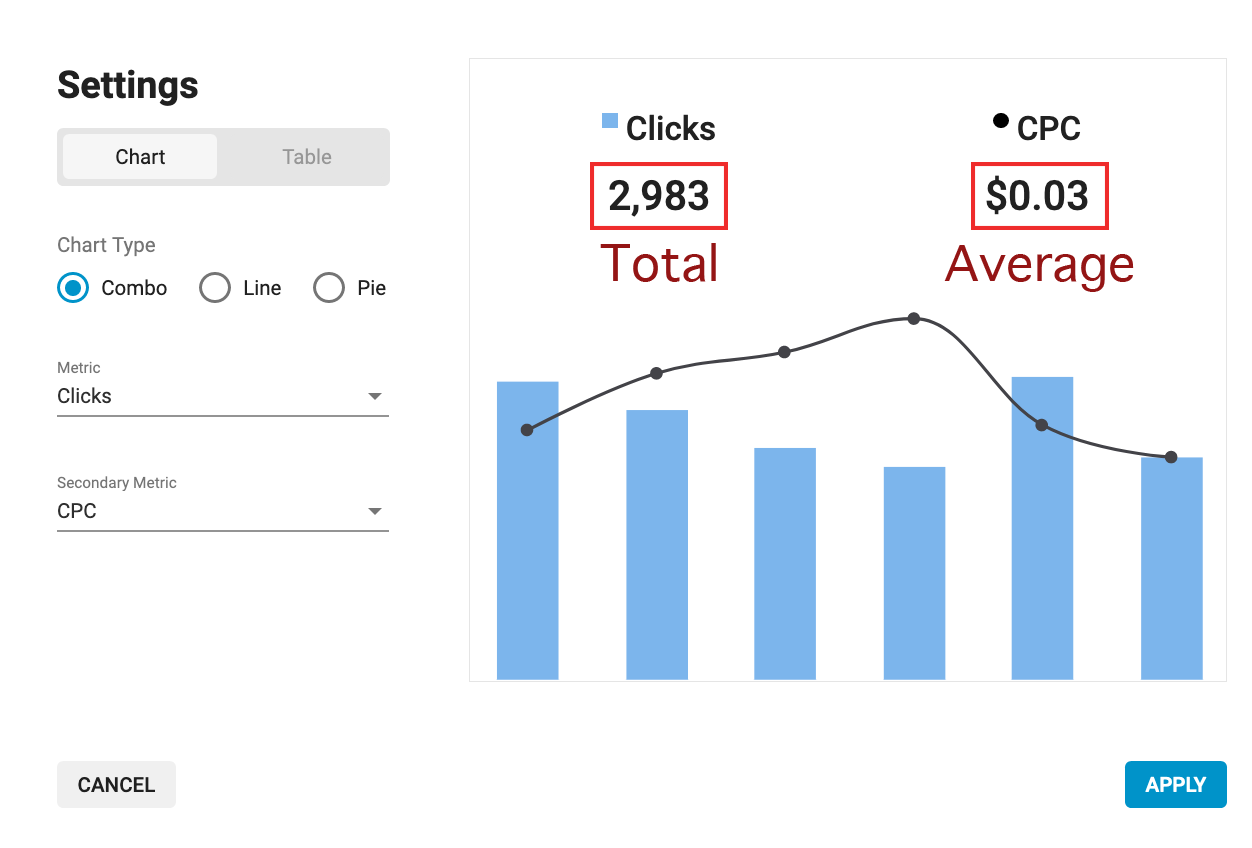
For each Metric and Secondary Metric, the total or average number for the selected time period will display at the top of the panel:
- The total will display for cumulative metrics such as Clicks, Costs, Revenue, Impressions, Video Impressions, etc.
- The average for the selected time period will display for metrics that not cumulative, such as CPC, CPM, CTR, Video > CPV etc.
- You can roll over any point in the chart to see the data for that period for both metrics.
Demo Video
Please view the video to see a demonstration of these changes.
