Statistics
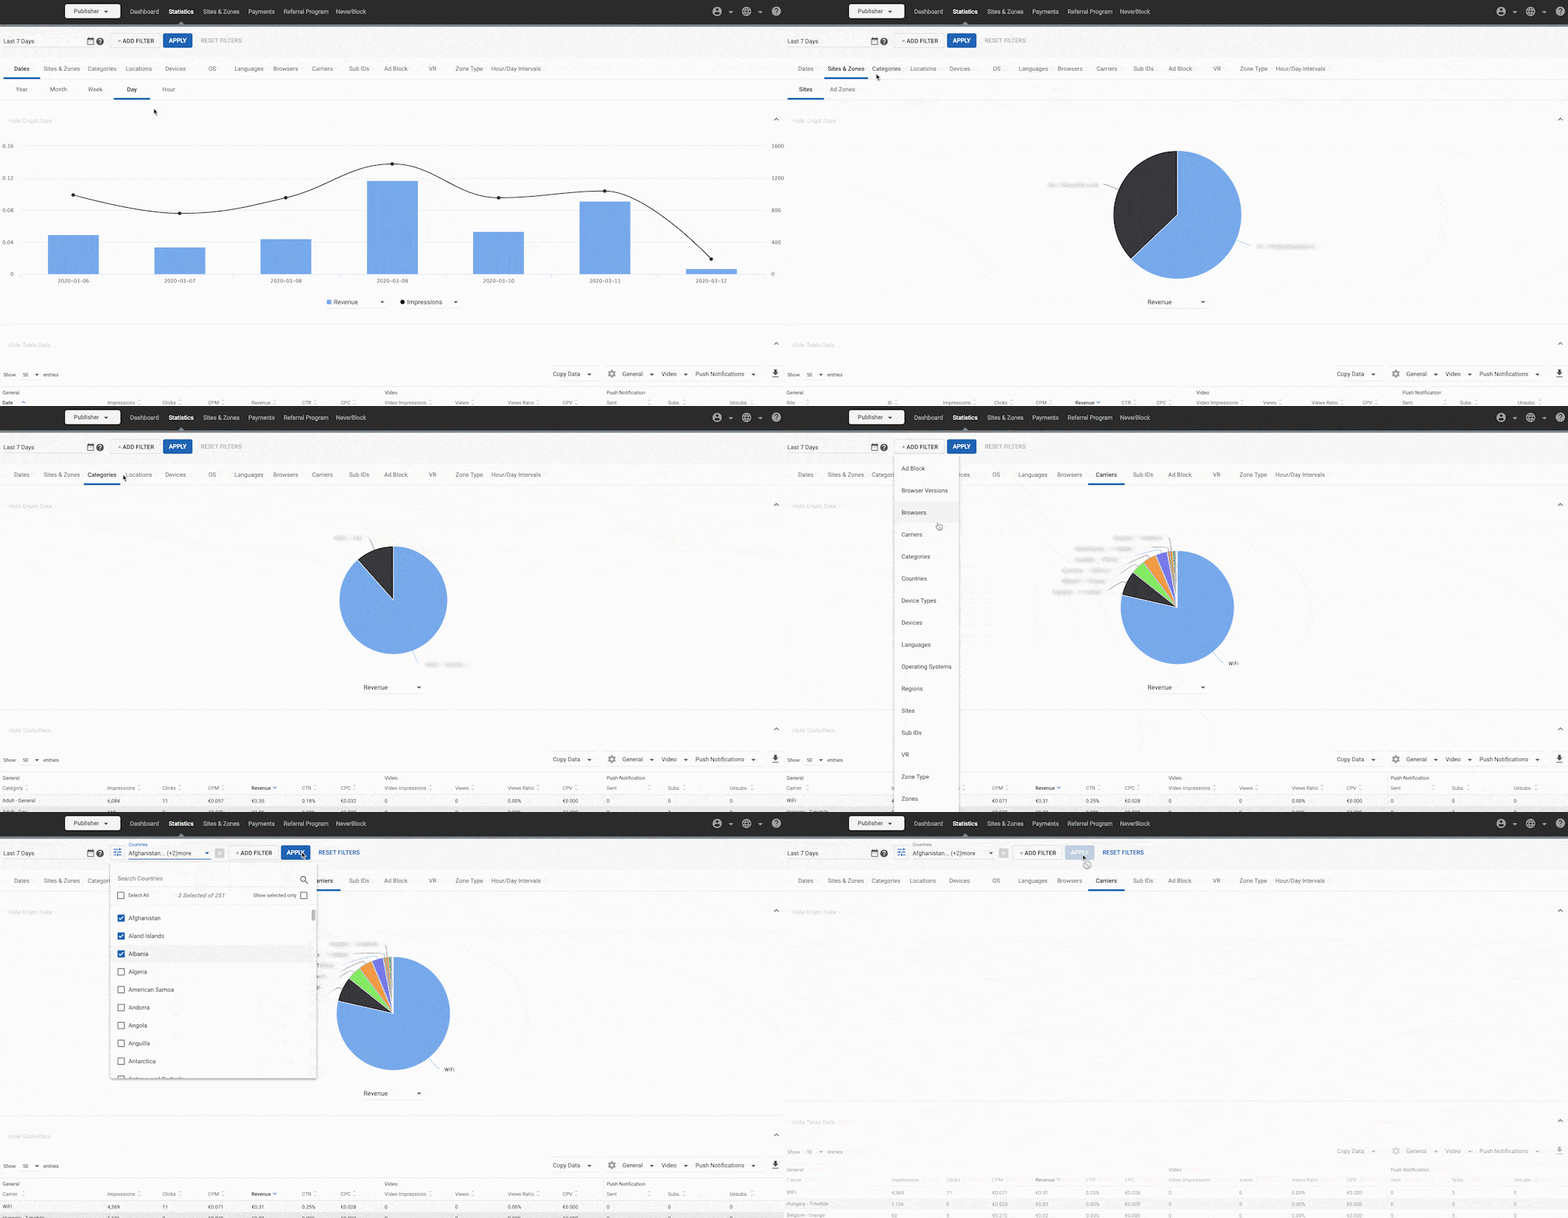
The Statistics tab shows you a wide range of information about the performance of your sites and ad zones. The Graph Data panel at the top of the screen shows you charts of data related to your campaigns, while the Table Data panel at the bottom shows you tables of important data for recent dates.
The information in the Statistics tab is broken down across several tabs: Dates, Sites & Zones, Categories, Locations, Devices, OS, Languages, Browsers, Carriers, Sub IDs, Ad Block, VR, Zone Type, and Ad Exchange.

By default, data is displayed using the New York time zone (EST or EDT). You should bear this in mind when analyzing statistics shown for your own time zone.
However, you can change the statistics time zone by clicking on your Statistics page and selecting the Hour tab. In the bottom right of the graph on this tab, you can set the time zone for your data based on your country targeting.
Saving Custom Filter Set
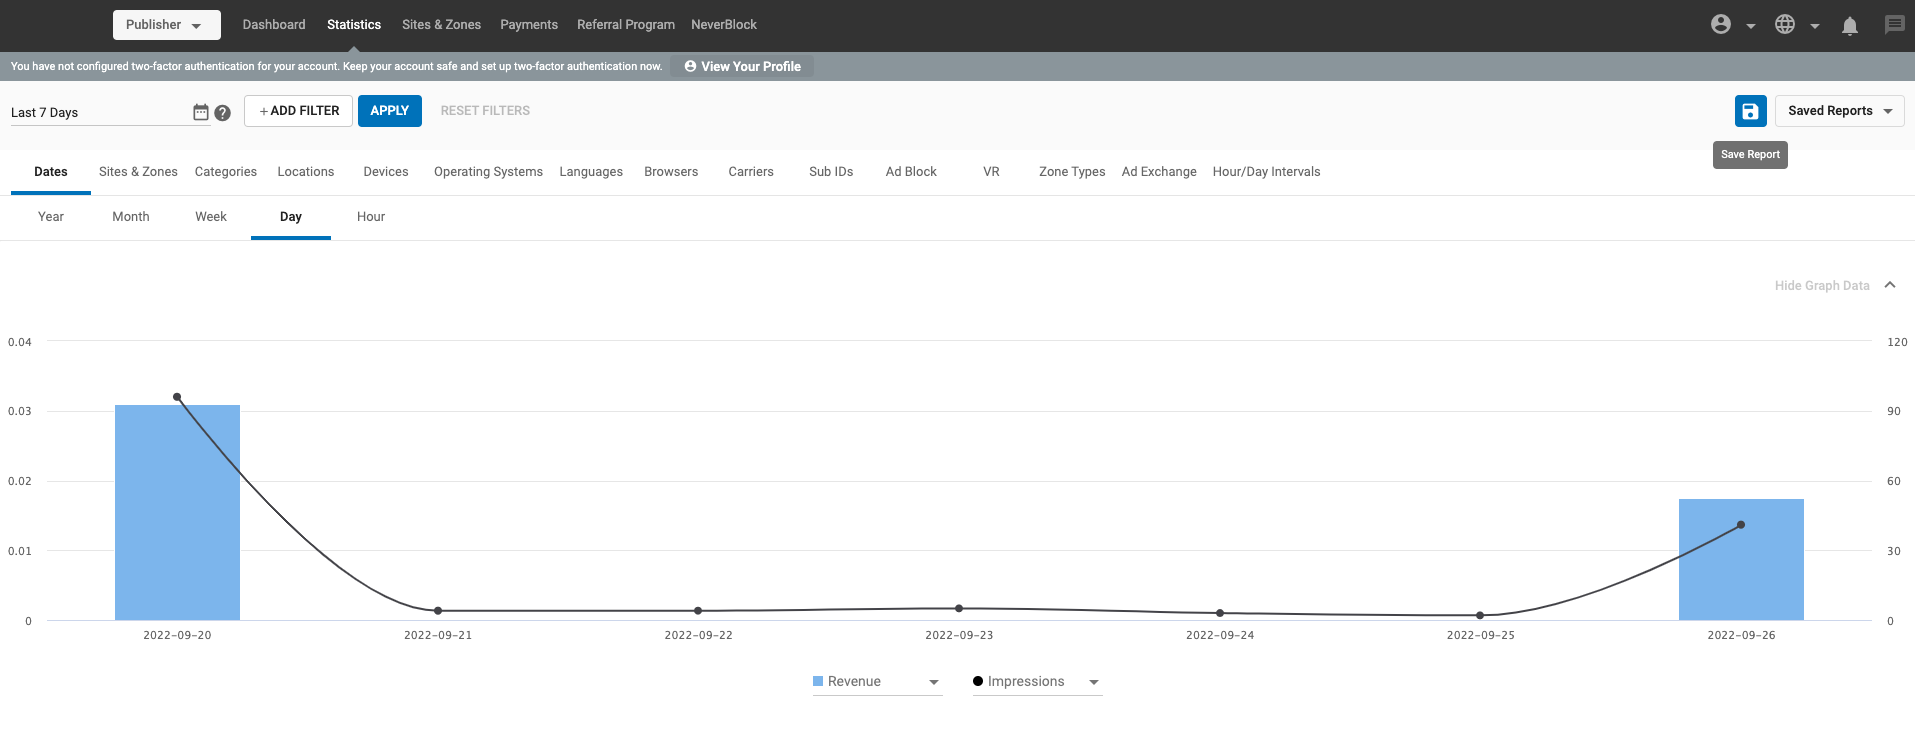
Using the Save Report option, you can save filter sets on the statistics page, give this filter set a custom name, and choose from a list of previously saved filter sets.
Saving a report
As a user, the default view of the statistics tab will not have any filters applied. You can either save a filter report by adding a few filters of your choice or choose from the list of already saved filters to obtain the desired view.
Note:
- The Statistics page will be reset once you leave to go to another page in Admin Panel.
- You can see the list of saved filters in the Saved Reports dropdown.
- The order of sorting the Saved reports will be the latest one created on top.
Update the existing report or Save As a new report
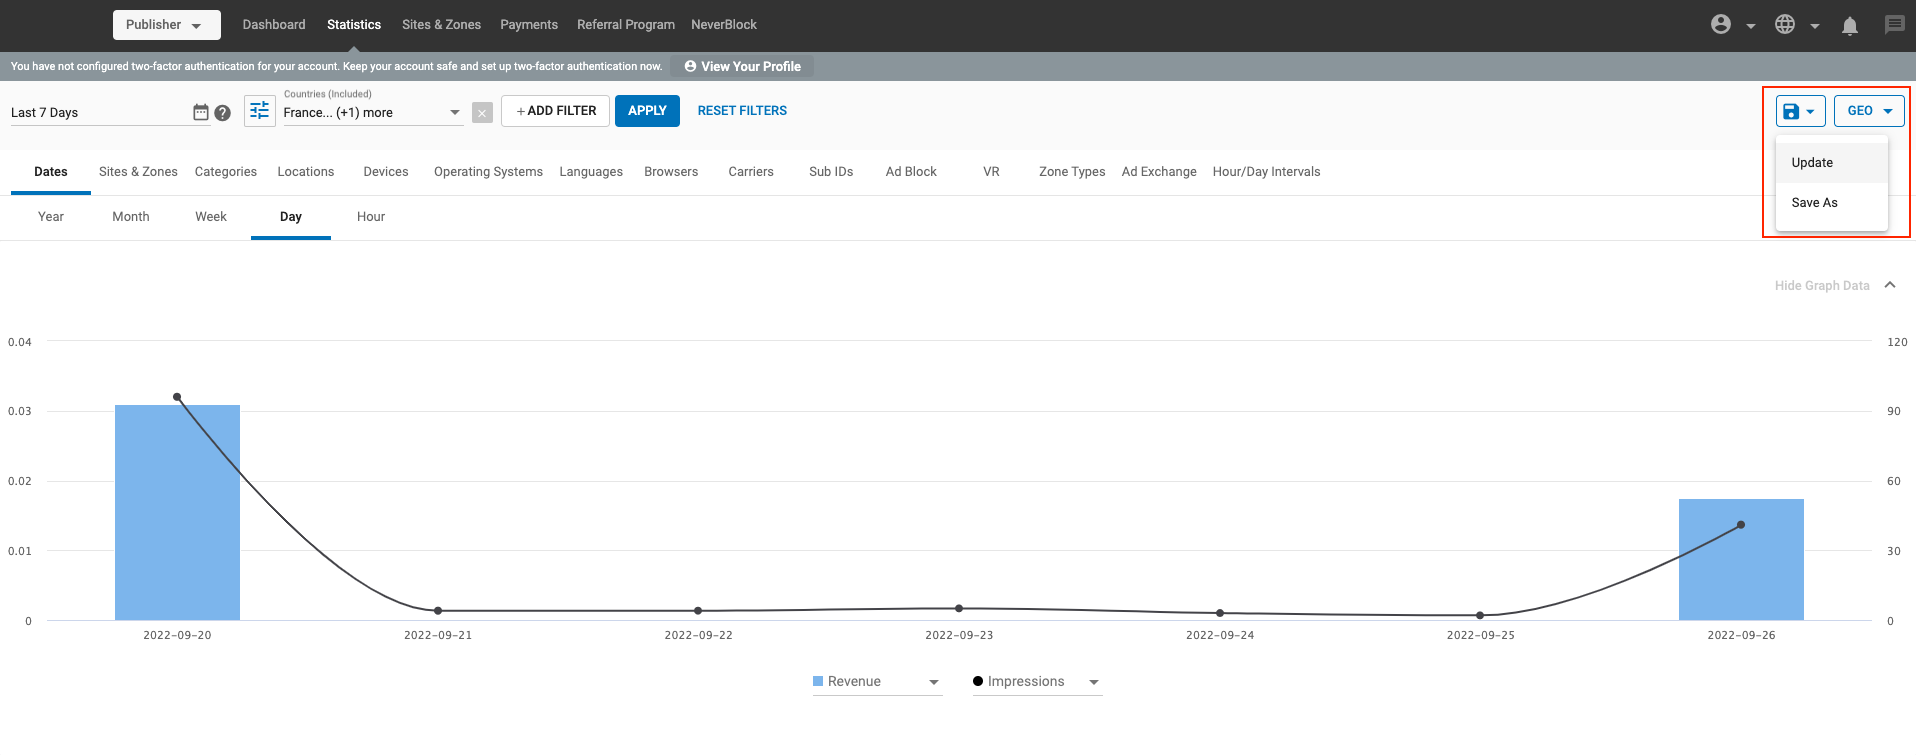
Update
- You can update an existing saved report by selecting it, changing the filters and then clicking on the Update button.
- The filter setting will be updated and saved under the chosen Saved Report.
Save As
- You can also save an existing filter set with another name by clicking on the Save As option.
- Or you can also Save As a new report by adding or removing a few filters from this set.
Rename, Delete a Saved Reports
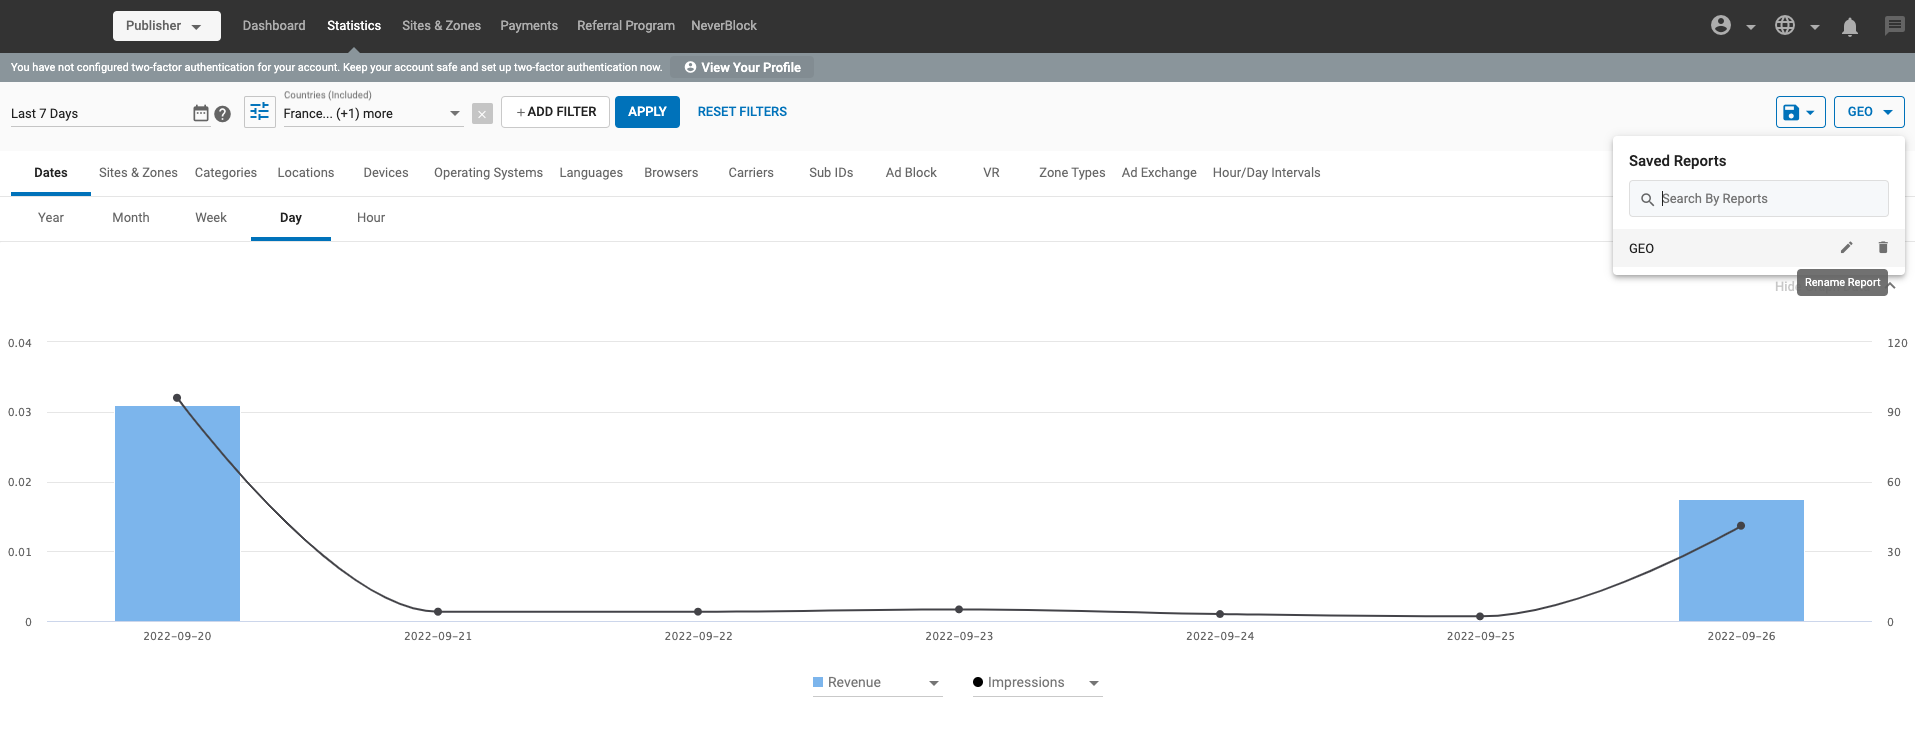
Using the action buttons against each saved report in the Saved Report drop-down, you can either edit or delete a report.
- The Pencil Icon helps rename a Saved Report. Note that no two reports can have the same name.
- The Bin icon helps delete a Saved Report. Note once a report it deleted, you cannot undo this action.
Multi-filtering your graph data

Note: Clicking on the This Month will allow you to choose a date/date range to view statistics for. You can choose a date as far back as January 2019.
You can filter the statistics showing in the graph in the currently selected tab using the multi-filtering options at the top of the screen. You can add multiple filters together to gain insights into your data. For example, if you are viewing costs for days in the Dates tab, you could choose to break that down by country and then further break it down by browser.
Using the filtering feature
To filter the currently selected tab by Ad Block, Browsers, Carriers, Categories etc. click on the +ADD FILTER button and select the item you wish to filter by.
Tick the boxes beside the items you wish to view, and click APPLY.
Note: When you have selected items in the filter drop-down, tick Show (x) selected only to hide unselected items from the list.
The results that you see will be filtered by the items that you have selected.
You can add more filters after the first one, for example, you might want to filter by Countries and then by Devices.
You can also filter the data by date, by clicking on the calendar icon to the left of the +ADD FILTER button.
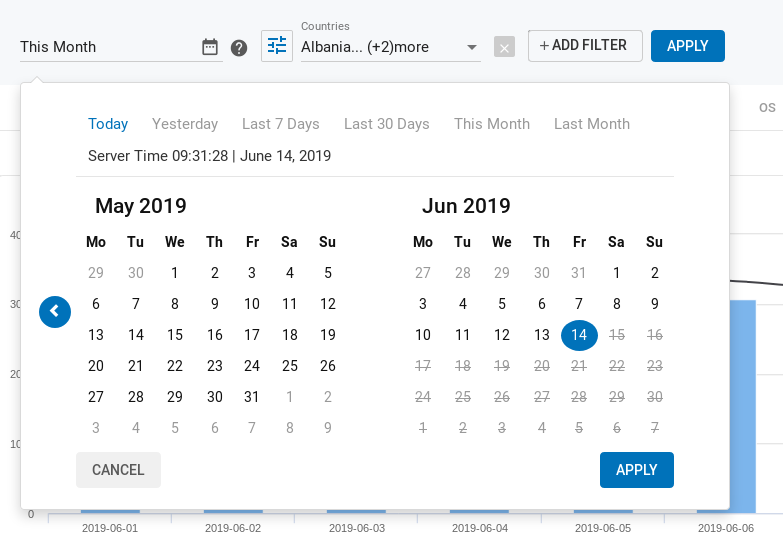
In the calendar box, you can select the time period you wish to view data for, either by dragging the mouse over the days you wish to select, or selecting from the predefined values:
- Today
- Yesterday
- Last 7 days
- Last 30 days
- This Month
- Last Month
Note: Choosing This Month in the Calendar will only show data for this month up to the current date.
Note: You can also drill-down into your data in the Table Data panel. Doing this will automatically add a filter to the multifilter bar at the top of the Statistics tab.
The Graph Data Panel
Choosing what to display in the graphs
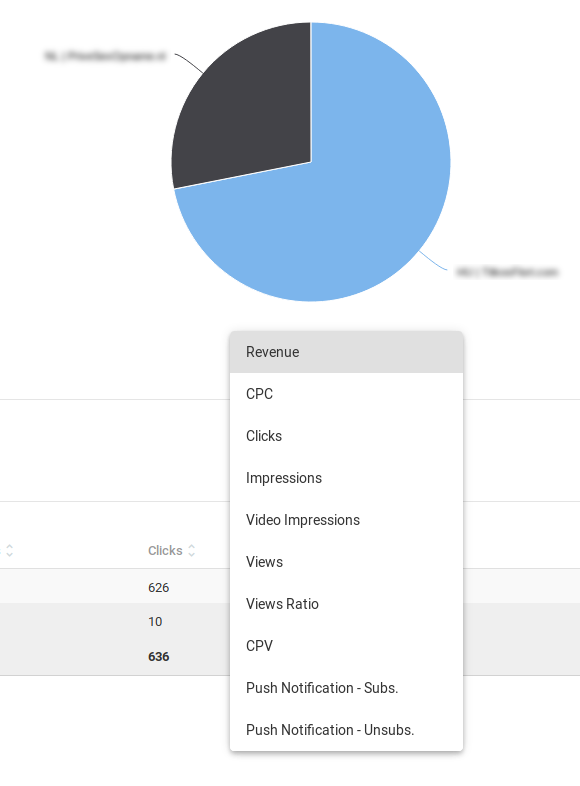
For all of the tabs in the Statistics tab, you can choose what information you would like to see in the graph in the top half of the screen: Choose Revenue, CPC, Clicks, Impressions, Video Impressions, Views, Views Ratio (the ratio of impressions to views), CPV, Push Notification - Subs. (Subscribed push notifications), Push Notification- Unsubs. (Unsubscribed push notifications) etc.
The following tabs all show a single pie chart with drop-down with the above options: Sites & Zones, Categories, Devices, OS, Languages, Browsers, Carriers, Sub IDs, and VR.
In the Dates tab, however, you can also choose from a second drop-down list for the line graph. This drop-down contains the same options as all the other graphs.
In the Locations tab, you can roll over the world map to see your data broken down by country. You can zoom in and out of the map using the + and - buttons on the left.
The Sub IDs tab shows data for any Sub IDs that you have set up.
The Ad Block tab shows how many users had Ad Block software installed on the device that they were using to view your site(s).
The Table Data Panel
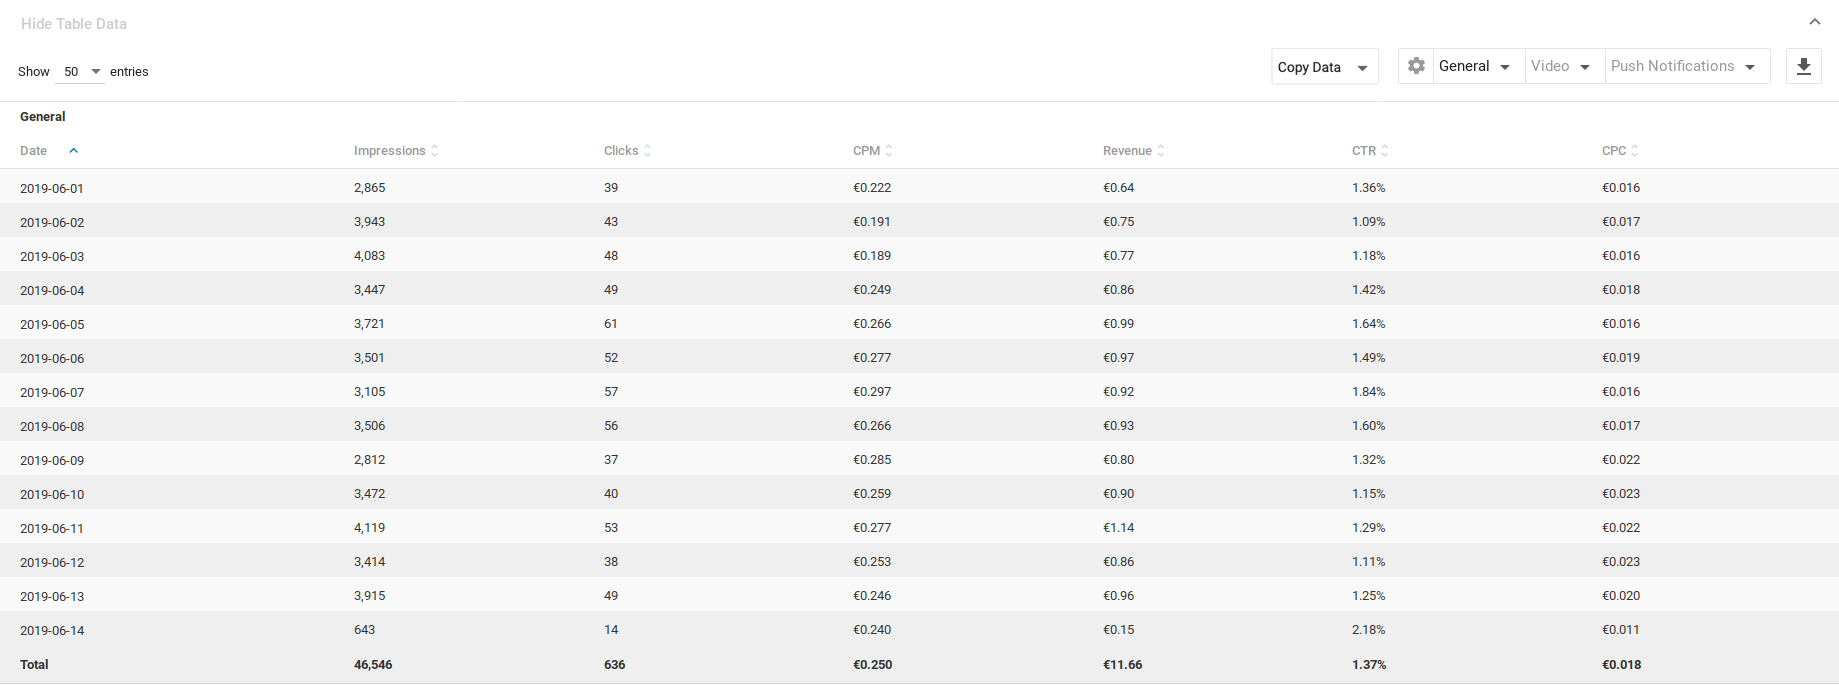
The Table Data panel shows the data in the Graph Data Panel in tabular format. In the Show X entries drop-down in the top right of the Table Data panel, you can choose how many lines of data you wish to see in the table. You can also click the arrows beside any of the column headers and sort the data from lowest to highest value.
The Table Data contains various statistics such as Impressions, Clicks, etc. about the items on the far left. You can choose which statistics to include in the table by clicking on the toggle options on the top-right of the panel.
Note: When viewing the Table Data for Dates, Sites & Zones, Locations and VR, you can click items in the far left to see the items broken down into their related sub-tabs. For example, clicking on a Country in the Table Data will take you to data for its Regions.
Toggle Options

The Toggle Options are found in the top right of the Table Data Panel.
- By clicking on the General drop-down menu, you can choose which columns you want to show/hide in the Table Data panel: Country, Impressions, Clicks, CPM, Revenue, CTR, CPC.
- By clicking on the Video drop-down (if available), you can switch on and off the video stats: Video, Impressions, Views, Views Ration, CPV.
- By clicking on the Push Notifications drop-down, you can switch on and off the push notifications stats that show in the Table Data panel.
Opening or downloading a CSV file of your statistics
You can also click the download icon on the far right of the toggle options to open or download a CSV file of your statistics.
Copying data
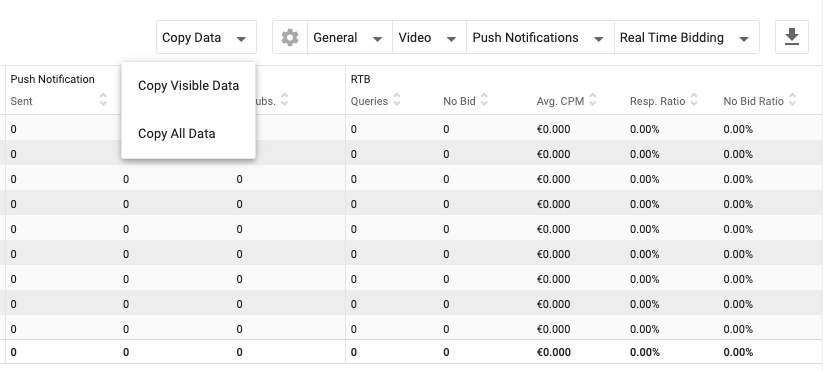
You can also copy the data in the Table Data so that you can paste it elsewhere, such as into an Excel sheet. Above the Table Data you will see the Copy Data drop-down.
- Choose Copy Visible Data to copy just the data that is visible in the table. This will copy only the data that you have chosen to see using the checkboxes above it (General, Video, etc.)
- Choose Copy All Data to copy all the available data. This will copy everything regardless of what you have chosen to see in the table.
